What Impact Did the Stock Market Crash Have on Biotech Stocks?

Contributing Author John Vandermosten, Senior Biotechnology Analyst
Examining events of the past can give us a sense of what to expect in the periods ahead. And despite the omnipresent warning that “past performance is not indicative of future results” we will share some historical trends on biotech performance surrounding economic contractions that may prove useful in the current environment. The pandemic disruption that has impacted our economy and the financial markets is unprecedented; however, many of the stresses and long term trends that we now face are similar to previous ones and may give us a hint on what to expect this time around.
How Did Biotech Do in Previous Crises?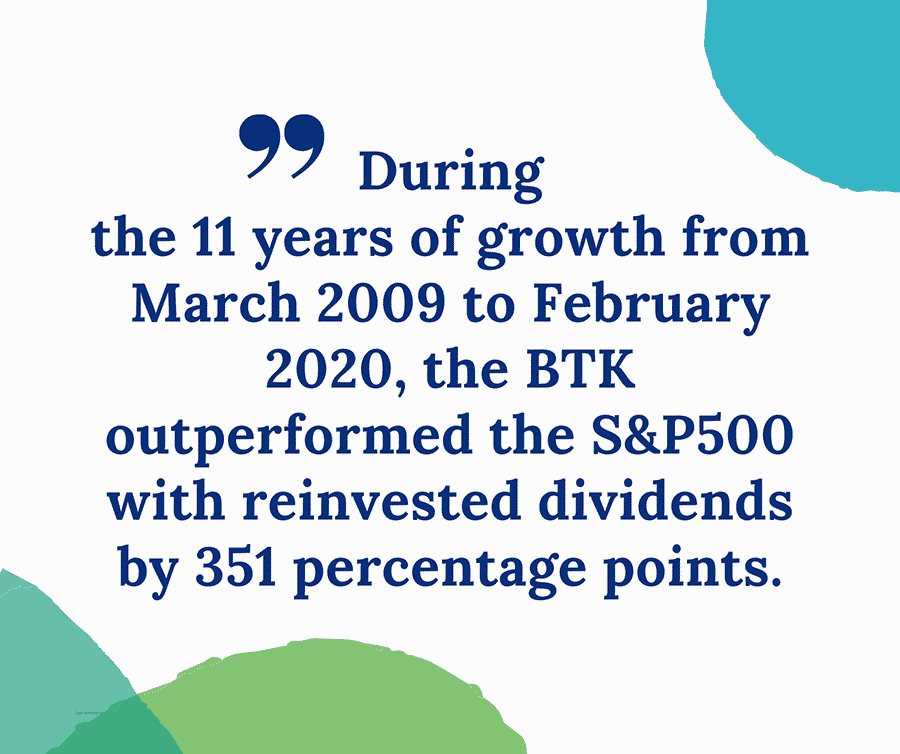
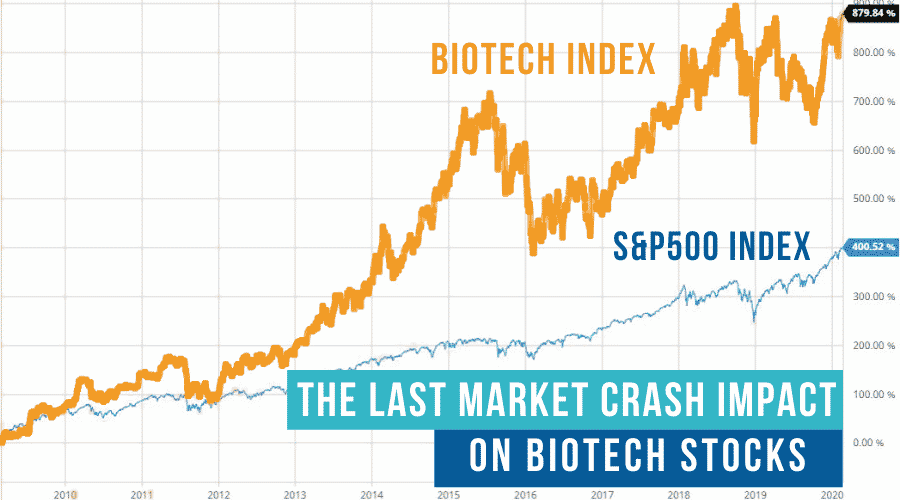
From March 2009 until mid-February 2020, the US stock market and economy had experienced almost 11 years of consistent growth with the S&P500 generating a total return of 529%1, equivalent to an 18% compound annual growth rate. This was an impressive streak until the coronavirus pandemic shut down non-essential activity and thrust the United States and most other economies around the globe into recession. From February 19th to March 23rd 2020, the S&P 500 declined 34%, a material amount of discretionary consumer activity halted and millions of jobs were lost. While it will take time to determine the extent of the contraction in economic activity and the near term result on companies, it is likely that there will be steep declines in earnings this year and many firms will close their doors.
Even though some non-essential parts of the economy may slow or stop, biotech work addresses critical needs and patient treatment in clinical trials must continue despite challenging circumstances. Additionally, much of the analysis and lab work required to advance a candidate through the trial process can be performed either remotely or in a safe environment with personnel that are accustomed to dealing with deadly diseases. Nevertheless, there are difficulties to be faced and capital is still needed, a vital requirement that can be uncertain during economic turmoil.
S&P500 (Orange) vs. Biotechnology Index BTK (Blue): February 19 to April 27, 20202

In previous recessions, biotech equities have fared better than the market as a whole. During the Great Recession, from December 2007 to June 2009 the S&P 500 fell by 37% while the NYSEArca Biotech Index (BTK) fell by 11%. A similar relationship held during the 2001 recession where the S&P500 fell by 8% while the BTK rose by 4% from March 2001 to November 2001. And again, during the Gulf War recession from July 1990 to March 1991, the S&P500 rose 5%, compared to the 73% increase in the biotech index.
S&P500 (Orange) vs. BTK (Blue): 2008 Recession3

S&P500 (Orange) vs. BTK (Blue): 2001 Recession4

Market Crashes and Recessions Hurt
During the 2008 recession, substantial economic damage was done. Corporations held elevated levels of debt, which led to many bankruptcies when they could no longer repay principal and interest. Financial institutions, auto manufacturers, and communications companies were in the worst position5 with dramatic financial restructuring required; however, other industries were not immune. During the 2008/2009 crisis, debt burden pushed small biotechs Epix Pharma and AtheroGenics into bankruptcy, forced asset sales by Nanogen, Alizyme and Biopure and prevented Altus Pharma, and MicroIslet from advancing their candidates to the next stage. In the eight months from September 2008 to April 2009, 120 biotech and pharma companies announced restructuring plans and seven filed for bankruptcy.6
Job Losses and R&D Cuts
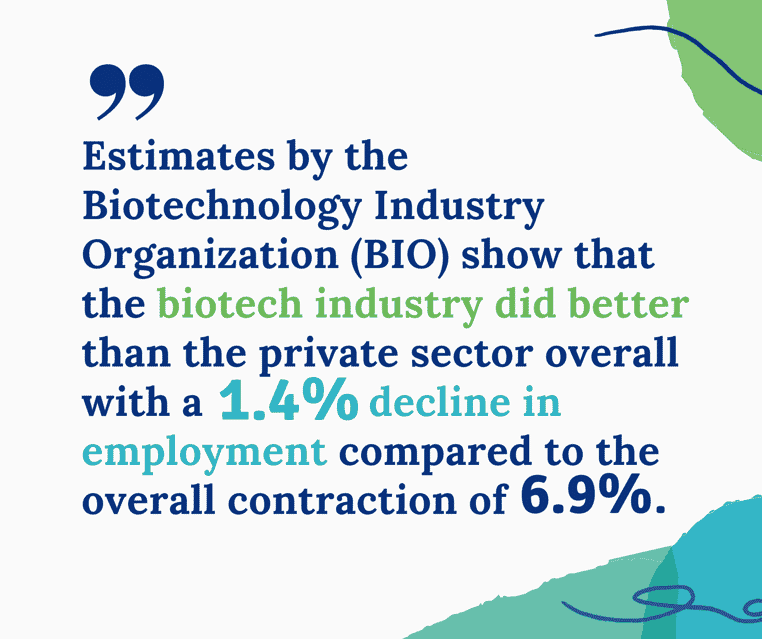
Job losses and R&D cuts were other adverse side effects from the economic turbulence. According to the Bureau of Labor statistics, 8.7 million jobs in the US economy were lost in 2008 and 2009. Over 71,000 of these jobs were lost in big pharma/biotech in 2008 including 10,000 by Pfizer, 8,400 by Merck and 5,475 by Johnson and Johnson.7 CBS News estimated another 5,000 layoffs by the industry in 2009. Estimates by the Biotechnology Industry Organization (BIO) show that the biotech industry did do better than the private sector overall with a 1.4% decline in employment compared to the overall contraction of 6.9%. Even with all of the layoffs, some companies were adding talent to their teams from the pool of out of work scientists. Private oncology company Forma Therapeutics raised $50 million in 2009 and doubled its employee count to 85. And large companies such as Genzyme, Merck Germany and Gilead were adding to their talent pool during this period.
Following the 2008 crash, there was much discussion in the media about companies cutting their research and development activities and shifting the focus to less capital intensive, early stage work. While the headlines for many of the top biotech companies suggested that there would be dramatic spending declines, upon closer inspection, the actual change in research and development was hardly a downturn. Examining R&D budgets for the largest companies in the industry, we see a 5% increase in 2008, a 1% decrease in 2009 and a 17% increase in 2010. Some of the individual organic company decline was offset due to merger activity including Merck’s (MRK) combination with Schering-Plough, highlighting the industry’s desire to focus on more developed assets at the expense of earlier stage work.
R&D Spending By Company 2007 – 20118

Merger and Acquisition Activity
According to a review9 by Zhang, the dearth of M&A activity in 2008 was reversed in the early days of 2009. Based on the author’s cut of the data, the value of M&A activity in 1Q:09 was greater than all of the activity for the entire year of 2008. As many of the larger companies focused on nearer term revenue opportunities, they favored advanced pipelines from smaller companies over their own early stage R&D projects. Large pharma was also facing multiple patent cliffs in the years after the crash, anticipating generic competition to blockbusters Plavix, Singulair and Viagra, highlighting the need for new pipeline candidates.
 Early stage biotech companies that were holding out for a great deal before the crash with dreams of billion dollar franchises had to reassess their expectations as they realized M&A was the only profitable exit strategy. Despite the difficult financial environment and troubles that investment banks were facing, there was only a small change in global life science deals in 2009 compared to 2008. And in 2010, there was a material jump in number of deals and in their value based on our review of all global life science M&A that was reported.10
Global Life Sciences M&A Transactions, 2006 to 201511

As the exhibit above shows, there was a small decline in the number of deals from 2008 to 2009 and a larger decline in deal value in percentage terms over the same period. However, this trend was quickly reversed in 2010, when we suspect the desire to get a deal done was more acute, sellers had more rational expectations and buyers felt a greater need to augment their portfolios. The trend continued for the next five years with the number of transactions increasing each year. While the 2008 crash and recession did slow down the trends in biotech and pharma, these events also seemed to emphasize the apparent synergies of combining companies that would benefit from advancing science and increasing market demand. For companies that survived, the prospects brightened considerably.
Venture Capital
While the impact from the 2008/2009 crisis did reduce the willingness to provide venture funding to early stage life sciences companies, it was a short-term phenomenon. Not only did deals and the amount of capital decline as a result of the recession, but the number of venture capital funds also declined from 443 to 388.12 Despite the pullback, volume and dollars increased in 2011 and continued to improve in subsequent years. Many of the highest returns achieved by VCs were investments made by funds that bet against the decline during the selloff. Some of the most successful investments include well-known tech giants Square, WhatsApp and Uber which all received initial investments in 2009. In the biotech space, Clovis Oncology was another 2009 vintage venture company which received $145 million. The company later went public and reached a peak market cap of almost $5 billion in July 2017.
US and European Early Stage Venture Investment13

IPOs
 Initial Public Offerings (IPOs) provide a gauge of the market’s interest in putting new money to work. The 2008 market crash, investor trepidation and failure of several investment banks initially put the brakes on the IPO market. IPOs seemed to anticipate the coming crisis and slowed well in advance of the crash in September 2008. During that year there were only a handful of biotech IPOs and none of them were listed or based in the United States. 2009 saw a slight pick up late in the year with three offerings on US exchanges, then activity accelerated in 2010 with 16 new companies presented as trading equities. 2011 and 2012 put 10 and 12 biotech companies into the public markets respectively. An explosion took place in 2013 and 2014 when the industry delivered 38 and 61 new public offerings. The economic volatility of 2008 did stall the number of IPOs initially, but when the economy recovered, there was a surge of pent-up demand for access to the public markets.
Post-2008 Recession IPOs: 2009 to 201614
click image to view it larger

More than Just Recession
The 2008/2009 period presented an abundance of material events beyond just the recession and market crash. A presidential election took place, a massive overhaul of the US health care system was on the horizon and a pandemic was underway around the globe. Executive orders issued by President Obama expanded the scope of embryonic stem cell research and guidance for biosimilars provided a pathway for this therapeutic class to reach the market. Each of these regulatory changes were anticipated to grow the industry.
In November 2008, the election of Barack Obama to the White House and Democratic control of both chambers of Congress made it clear that something would be done on the topic of healthcare. A new paradigm was on the table and investors were concerned that health insurers and hospitals would not survive in their current form and drugs would be subject to price compression. On one hand, the market’s concern over how the health care ecosystem would change dramatically increased the risk perception for this sector of the economy.

On the other hand, there were governmental efforts to help expand scientific research, including an executive order to allow for expanded stem cell research in March 2009. The benefits of this action were enhanced by the implementation of the American Recovery and Reinvestment Act, which became law in February 2009.This legislation allocated $155 billion to health care, with $10 billion for health research and construction of NIH facilities. Several new technologies were maturing during this time such as genetic sequencing, immuno-oncology, interference RNA and anti-virals15 which would create billions of dollars of value in the coming years. Companies such as Illumina went from a $3 billion market cap at the end of 2008 to over $20 billion by 2014. Drugs like Keytruda and Sovaldi that were in late stage trials at this time went on to generate billions in annual revenues a few years later.
FDA Product Approvals16

 The Swine Flu emerged in the United States in April 2009, several months into the recession, and by early June, a global pandemic was declared.17 Using the strain change pathway, global health authorities identified prototype vaccines to be produced in August 2009 for first inoculations to be given in December. An estimated 61 million cases occurred in the United States with ~12,500 deaths. Disruption to markets, loss of confidence and changes in spending patterns added to the previous year’s crash and ongoing recession. But through it all, biotech held its head up high.
Government funding and scientific advancements provided a strong investment rationale that supported continued interest in biotech during the difficult days of the recession and crash. Even companies like American Gene Technologies were able to advance their critical work in gene therapy through the award of grants and access to government supported bio-incubators to advance preclinical research in the field.
Cash
Cash is the all-important buffer that can turn a crisis into an opportunity for those who have access to it. In 2008, the top 20 pharmaceutical and biotechnology companies18 held cash and equivalents of $110 billion. At the end of 2019, this total was $159 billion, 45% greater than eleven years earlier. According to the Federal Reserve, at the end of 2019 there was $21.3 billion held in cash balances19 compared to $13.8 billion at the end of 2008.20 While not all of this is investible in new issues, it is available to take advantage of opportunities that arise when valuations are attractive.
Large biotech and pharma companies and the system as a whole have substantially more cash on their balance sheets in 2019 than they did in 2008; however, they also have higher levels of debt.21 This provides additional ability to make acquisitions without tapping bank resources but it also places these companies in a highly leveraged position.
Takeaways From The Last Market Crash of 2008
Public pharma and biotech companies have held up during periods of recession better than the market as a whole.
An aging population, scientific advancement and less discretionary nature of health care provides support for this industry.
The 2008 turmoil resulted in bankruptcies, layoffs, cutbacks and failures in life sciences, especially for early-stage companies lacking cash.
- However, the space suffered fewer bankruptcies, layoffs, cutbacks and failures compared with the broader economy.
Scientific advancement and drug development continued despite the economic turbulence, yielding dramatic growth in products such as anti-virals and immuno-oncology drugs.
Government provided counter-cyclical financial support for early stage R&D.
M&A held up on a global basis and expanded aggressively in the years after the crash/recession.
- Sellers & buyers were more incentivized to make deals.
The crash and recession offered an attractive buying opportunity for all types of capital.
IPOs stalled prior to the crash/recession, but rapidly achieved new highs afterwards.
Crash and recession cleared out many of the weaker players, leaving stronger candidates to attract capital.
There is always cash on the sidelines, waiting for attractive opportunities.
Past history suggests that biotech is both relatively and absolutely attractive during market crashes and recessions.
What’s Happening Now?
Today’s 2020 Market in the Midst of the Covid-19 Coronavirus
Over the last few months we have seen a tremendous amount of financial market volatility with a dramatic contraction of economic activity, combined with astonishing increases in unemployment. Despite the dreary economic conditions, we point to one domain that has held up well: life sciences IPOs. As of May 8th, 2020 there have been 15 new equity issues that have an average return of 60%. Only one has a negative return and four have a return over 100%.
Our readers should check back often to find new articles that discuss finance, the economy and how life sciences companies use their creativity to cure.
American Gene Technologies (AGT) sponsored this article to help provide information to investors and other interested parties to support companies working on treatments and vaccines that will benefit global health.
1 Return calculated as difference in S&P 500 total return index (SP500TR) from March 9, 2009 (1,095.04) to February 19, 2020 (6,886.47) for a total return, including reinvested dividends, of 529%. The Biotechnology Index (BTK) returned 880% over the same period, ignoring dividends.
2 Return calculated as difference in S&P 500 Index (SPX) from February 19, 2020 (3,386) to March 23, 2020 (2,237) vs. the US Biotech Index (BTK) over the same period (5,308 vs 3,856). Source: barchart.com
3 Source: barchart.com
4 Source: barchart.com
5 According to an August 2011 Forbes article, the biggest bankruptcies of the 2008/2009 period were Lehman Brothers, Washington Mutual, General Motors, CIT Group, Chrysler, Thornburg Mortgage, General Growth Properties, Lyondell Chemical, Colonial BancGroup, Capmark Financial Group, Ambac Financial Group, Guaranty Financial Group, BankUnited Financial, Charter Communications and Tribune Company.
6 Zhang, J. Impact of The Financial Crisis On The Pharma And Biotech Industries. Life Science Leader, July 4, 2009.
7 Source: Pharmalot Blog
8 Source: Zacks Research System and Company Reports
9 Zhang, J. Impact of The Financial Crisis On The Pharma And Biotech Industries. Life Science Leader. July 4, 2009
10 We relied on Evaluate Pharma data for all public and private deals that took place using a broad definition of the healthcare and life sciences space. Transaction value was not available for a material number of transactions, but we included it in our totals where available.
11 Source: Evaluate Pharma database and author’s work. Data is for all transactions, public and private for all countries. Data includes deals for the following industries: Biotech/Pharma, R&D Services, CRO, Generic, Healthcare Services, Hospital & Healthcare Supply, Medtech, Pharmaceutical, and Specialty Pharmaceuticals and Biotechnology. Transaction value includes amounts where information was available. Valuation data is not available for many smaller transactions and most private transactions.
12 Bowery Capital Insights. What Will Happen to Venture Capital When the Recession Hits?
13 Source: Ernst & Young Biotechnology Report 2017. Beyond Borders: Staying the Course.
14 Author’s own work using a variety of public sources.
15 13 anti-viral drugs were approved from 2011 to 2014 including the $10B+ Sovaldi. This compares to 5 approvals from 2007 – 2010.
16 Source: Ernst & Young Biotechnology Report 2017. Beyond Borders: Staying the Course. Based on approvals by the FDA’s Center for Drug Evaluation and Research (CDER).
17 The WHO declared global pandemic for the Swine Flu on June 11, 2009.
18 We started with the top 25 and then eliminated the ones that were not in that group in 2008.
19 This includes money market, checking accounts, savings and certificate of deposits.
20 Federal Reserve Financial Accounts of the United States.
21 The same top 20 companies held $111 billion in debt as of December 2008, which increased to a whopping $370 billion of debt in December 2019. Source: Zacks Research System, company reports.